Summer in the Northern Hemisphere is now well underway. June 2025, the season’s first month, ranked as the third warmest June ever recorded, according to NOAA. Global surface temperature records date back to 1850, meaning this result is based on 176 years of measurements.
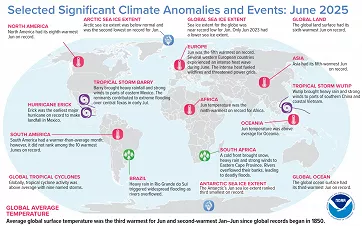
June 2025 Selected Climate Anomalies and Events Map; NOAA
The average global temperature in June was 0.98 °C (1.76 °F) above the 20th-century average, and 0.46 °C above the 1991–2020 baseline. Only June 2023 (+0.51 °C vs 1991–2020) and the record-breaking June 2024 (+0.67 °C vs 1991–2020) were warmer globally.
From a regional perspective, Europe and Asia experienced their fifth warmest June on record, North America the eighth, and Africa the ninth.
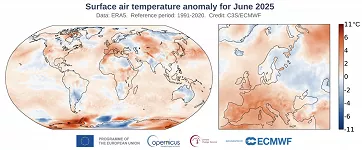
Surface air temperature anomaly for June 2025 relative to the June average for the period 1991-2020; Copernicus
In June 2025, extreme temperatures and heatwaves affected many regions across the Northern Hemisphere. Several episodes brought intense heat to large parts of North America (including Mexico and the southern and eastern United States), southwestern and western Europe, the Middle East (with a potential Asian temperature record of 54.3 °C currently under verification in Kuwait), as well as parts of South Asia (Pakistan) and East Asia (including Siberia, China, and Japan).
Definition of a Heatwave
There is no globally standardized definition of a heatwave, and the criteria for declaring one vary depending on the local climate, geography, and social conditions of each region or country. The World Meteorological Organization (WMO) defines a heatwave as “a period of unusually hot weather, statistically unusual, lasting several days and nights.”
Different meteorological services apply their own specific thresholds. The duration of extreme temperatures required to declare a heatwave is often set at 3 days (e.g., in the United Kingdom, Australia).
Behind the formation of a heatwave
Shorter heatwave episodes lasting one to three days are often caused by the advection of very warm air from lower latitudes, in Europe, typically from the Sahara. Under sunny conditions, this warm air heats up further as it moves over the hot land surface, leading to a continued rise in temperatures.
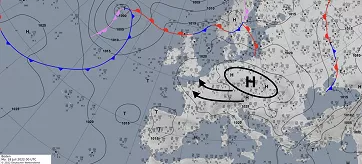
Synoptic analysis from 18 July 2022 at 00 UTC (black arrows indicate the direction of warm air advection around the anticyclone); DWD
The advection of very warm air was the cause of the heatwave that struck parts of Western Europe in mid-July 2022. In the United Kingdom, a new temperature record of 40.3 °C (104.5 °F) was set, surpassing the previous all-time high by 1.5 °C (2,7 °F) . Temperatures exceeded 40 °C (104 °F) in France, 45 °C (113 °F) in Spain, and 46 °C (114.8 °F) in Portugal. During the exceptionally hot summer of 2022, extreme heat claimed the lives of more than 60,000 people across Europe.

Daily max temperature anomalies during the 2022 Western Europe heatwave; Kai Kornhuber et al., 2024
Prolonged heatwaves are often associated with a blocking high-pressure system known as a heat dome. In the center of such a system, air sinks and warms adiabatically as it descends, while also preventing the upward movement of warm air from the Earth’s surface. This leads to the accumulation of heat in the lower layers of the atmosphere. Weak vertical air movement further limits cloud formation, allowing more solar radiation to reach the surface, which in turn heats up, along with the air above it.

How a heat dome forms; adapted from AFP, 2021 and Hills and others, 2021 via Copernicus
The occurrence of blocking high-pressure systems is closely linked to the jet stream. When the upper-level flow becomes wavy and forms meanders, a blocking high can develop in areas where the stream bends toward the polar regions. Research suggests that when five meanders form in the Northern Hemisphere jet stream, heatwaves typically occur over North America, East Asia, and Eastern Europe. With seven meanders, extreme heat tends to concentrate over western and central North America, Western Europe, and Western Asia.
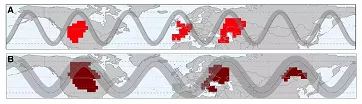
Jet stream waves 7 (A) and 5 (B), with red and brown areas showing reduced crop yields over the past 40 years.. Kornhuber et al., Nature Climate Change, 2019 via Krajick, 2019
An example of a heatwave caused by a so-called heat dome is the extreme nine-day heat event that struck western Canada and the northwestern United States at the end of June and beginning of July 2021. In many places, temperatures exceeded 40 °C (104 °F), and on June 29, an extraordinary temperature of 49.6 °C (121.3 °F) was recorded in the Canadian town of Lytton, British Columbia, setting a new national heat record. The following day, the town was almost completely destroyed by a massive wildfire that spread rapidly, fueled by extremely dry vegetation. The heatwave had devastating consequences, it claimed more than 1400 lives, triggered widespread wildfires, and caused severe air pollution from smoke across the region.
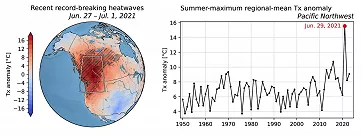
Daily maximum temperature anomalies during the 2021 Pacific Northwest heatwave; Kai Kornhuber et al., 2024
Impacts of Extreme Heat and Heatwaves
Extreme heat sets off a chain of complex, interconnected processes in both nature and society, ranging from wildfires and droughts to storms, infrastructure failures, and shortages of water and food.
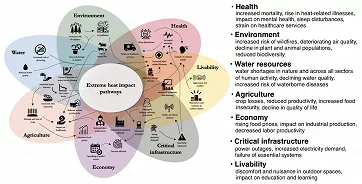
Interrelated and compounding impacts resulting from extreme heat; Climate Central, 2024 (supplemented with text)
Extreme heat during heatwaves places significant thermal stress on the human body, not just due to air temperature, but also because of humidity, solar radiation, wind, surrounding environment, and physical activity.
When the body cannot release excess heat, the risk of heat exhaustion or heatstroke increases. High thermal stress strains the heart and kidneys and worsens chronic illnesses such as cardiovascular, respiratory, mental, or diabetic conditions.

Number of days in 2024 during which at least ‘strong heat stress’ was experienced, based on the daily maximum feels-like temperature exceeding 32°C; Copernicus, 2025
Globally, extreme heat causes more deaths than any other type of extreme weather. Between 2000 and 2019, around 489000 people died each year due to high temperatures, with most deaths occurring in Asia (45%) and Europe (36%).
However, these numbers are only estimates, as heat-related deaths are often underreported. Moreover, heatwaves can also raise mortality indirectly through drought, poor water quality, wildfires, or infrastructure failures.
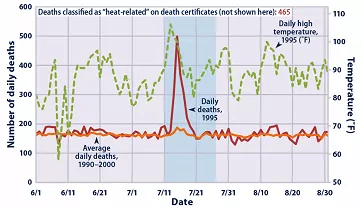
Examining heat-related deaths during the 1995 Chicago heat wave; EPA
The July 1995 Chicago heatwave caused 465 confirmed heat-related deaths in Cook County, though studies suggest heat may have contributed to hundreds more.
Impacts of heatwaves in cities
Heatwaves and extreme temperatures have particularly strong impacts in urban environments. Cities are affected by the so-called urban heat island effect, where temperatures are significantly higher than in the surrounding rural areas. Dense development, asphalt surfaces, lack of greenery, and high population density all contribute to greater heat accumulation during the day and reduced cooling at night.
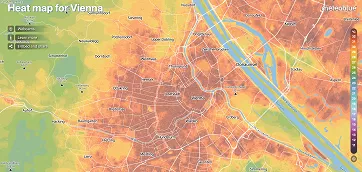
A heat map of Vienna shows temperatures several degrees higher in the city center than in parks and surrounding areas; meteoblue
Urban areas can be 5 to 10 °C (9 to 18 °F) warmer than the surrounding countryside, intensifying heatwaves and increasing related risks. In 2023, the temperature difference between the surface of London and the surrounding rural landscape reached up to 7 °C (12,6 °F). The greatest differences occurred during the summer months, when the heat accumulated during the day could not dissipate sufficiently over the short night.

Surface Urban Heat Island Index for maximum (red) and minimum (orange) temperatures for London in 2023; Urban Climate Explorer via Copernicus, 2023
An example of how extreme temperatures can affect the functioning of society in an urban environment can be illustrated by the following scenario:
High temperatures increase thermal stress, which can lead to exhaustion, heatstroke, or worsening of chronic illnesses, especially among vulnerable groups such as children, the elderly, pregnant women, or people working outdoors. Heat also reduces work productivity and can result in economic losses.
Rising demand for cooling increases the load on the power grid, which can become overloaded and lead to blackouts, precisely at the time when electricity is needed most.
Intense sunlight and traffic emissions worsen air quality and increase ground-level ozone concentrations, which cause or exacerbate respiratory illnesses.
Heatwaves are often accompanied by drought and high evaporation, which reduce water availability for personal use, industry, and public services. The risk of wildfires also increases. Extreme temperatures can also damage infrastructure, such as deforming roads, rail tracks, or building structures.
These phenomena interact with one another and can lead to disruptions in urban services, significant economic losses, and increased illness or even mortality among the population.
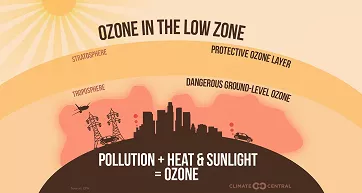
Diagram of protective stratospheric ozone and harmful tropospheric ozone; Climate Central, 2019
The Dynamic Evolution of Cities
Cities and settlements are constantly evolving. Their populations grow or decline, economic activities expand or contract, and political priorities shift. The risks that cities and their inhabitants face, now and in the future, are shaped both by changes within the urban environment itself and by climate change.

Growth rate of urban agglomerations between 1990 and 2018; United Nations, Department of Economic and Social Affairs, Population Division (2018)
According to the United Nations, 55% of the world’s population lived in cities in 2018 (with urbanization rates of 82% in North America, 65% in China, and only 43% in Africa). Between 2015 and 2020, the global urban population grew by more than 397 million people, with over 90% of this growth occurring in less developed regions. By 2050, the share of the urban population is expected to rise to 68%. This increase must also be viewed in the context of overall global population growth.
As the number of urban residents increases, more people will be exposed to the urban heat island effect. At the same time, the effect itself is expected to intensify due to climate change, according to the Intergovernmental Panel on Climate Change (IPCC).
Global temperature increase
The year 2024 was the warmest year on record. The average global temperature reached 15.10 °C (59.18 °F), which is 0.72 °C (1.30 °F) above the 1991–2020 average and 0.12 °C (0.22 °F) higher than the previous record set in 2023. Compared to the pre-industrial period (1850–1900), 2024 was 1.60 °C (2.88 °F) warmer. This marks the first time the symbolic threshold of 1.5 °C (2.7 °F) of global warming has been exceeded.

Surface air temperature anomalies in 2024, relative to the average for the 1991–2020 reference period; Copernicus, 2025
The WMO warns that global warming is currently occurring at an exceptionally rapid pace. Every year from 2015 to 2024 ranked among the ten warmest years on record, and global temperatures are expected to continue rising.
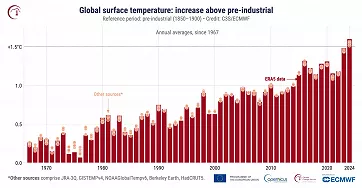
Global surface air temperature (ºC) increase above the average for the 1850–1900 designated pre-industrial reference period; Copernicus, 2025
As global temperatures rise, the frequency, intensity, and duration of extreme events such as heatwaves, heavy rainfall, droughts, and tropical cyclones are also increasing.

Observed and attributed changes in regional hot extremes; IPCC, 2023
According to the WMO, there is an 86% probability that at least one of the next five years will be more than 1.5 °C (2,7 °F) warmer than the average for the period 1850–1900. There is also an 80% probability that one of these years will surpass 2024 as the warmest year on record.
The Sixth Assessment Report of the IPCC uses five key scenarios to estimate future changes in global temperature and related climate phenomena, such as changes in precipitation, extreme weather events, or sea level rise. These scenarios are based on different assumptions about the future development of greenhouse gas emissions.

Global surface temperature changes relative to 1850–1900 under various greenhouse gas emissions scenarios (left), and the relationship between cumulative CO₂ emissions and associated global temperature increase (right); IPCC, 2023
The IPCC scenarios consider different developments in CO₂ emissions, ranging from a rapid decline and the achievement of net-zero (or even negative) emissions around mid-century in the “very low” scenario, through gradual reductions in the “low” scenario and stabilization in the “intermediate” scenario, to continued growth in the “high” scenario and the fastest increase in the “very high” scenario, where emissions remain high even at the end of the century.
Observations and climate models indicate that global warming occurs with varying intensity across the globe. Land areas are warming more than oceans, and mid- to high-latitude regions more than the tropics.

Impact of global temperature rise on regional temperature distribution; IPCC, 2023
Global Climate Shifts of Cities
An analysis by Climate Central aims to determine how dramatically the climate of major cities could change if the current pace of greenhouse gas emissions is not slowed (corresponding to the IPCC “very high emissions” scenario). For selected cities, average daily summer maximum temperatures at the end of the century were calculated and compared to cities that currently experience similar temperatures. Future warming could effectively “shift” the climate of some cities to resemble that of entirely different regions of the world.

Expected climate shift in selected cities by 2100 without mitigation efforts; Climate Central, 2025
By the year 2100, London’s summer climate could resemble that of present-day Milan, while Milan may shift toward the climate of Port Said in Egypt. Baghdad and other cities in the Middle East are projected to face such extreme warming that their future climate will have no current equivalent anywhere in the world.

Expected climate shift in Boston by 2100 without mitigation efforts; Climate Central, 2025
In the United States, the summer future of 247 major cities was analyzed. By 2060, warming of 2 °C (3.6 °F) is expected, and by 2100, an increase of 4.4 °C (7.9 °F). On average, summer conditions will shift approximately 700 kilometers (435 miles) southward.
For 16 U.S. cities, however, no comparable climate will exist within the continent, as their future conditions will resemble those of present-day Pakistan, North Africa, or the Arabian Peninsula. The greatest warming is expected in the city of Mitchell, South Dakota, where by 2100, summer could resemble today’s Wichita Falls, Texas (+6.2 °C / 11.1 °F).
The five largest U.S. cities, which are home to a combined population of over 19 million people, are projected to experience the following changes by the end of the century:
- New York: warming of 4.2 °C (7.6 °F), with a climate resembling that of Columbia, South Carolina
- Los Angeles: +3.2 °C (5.8 °F), similar to Túxpam, Mexico
- Chicago: +5.1 °C (9.1 °F), similar to Montgomery, Alabama
- Houston: +3.6 °C (6.4 °F), similar to Lahore, Pakistan
- Phoenix: +4.0 °C (7.2 °F), similar to Al Mubarraz, Saudi Arabia
The future of cities
Heatwaves are among the most dangerous natural meteorological phenomena. According to the IPCC, the number of people exposed to these extremes is expected to increase as global temperatures rise. If greenhouse gas emissions are not reduced and no adaptation measures are taken, the impacts of rising temperatures and more frequent heatwaves will continue to worsen.
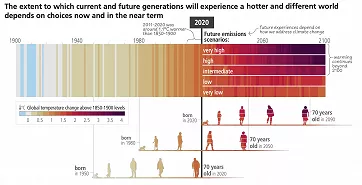
Global surface temperature: Observed (1900–2020) and projected (2021–2100); IPCC, 2023
Rapid urbanization, a lack of climate-sensitive planning, and the persistent urban heat island effect increase the vulnerability of urban environments and critical infrastructure.
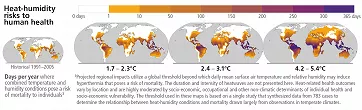
Future climate change and its impact on human health; IPCC, 2023
As climate change continues to intensify, the urgency of adaptation measures is growing as well. Mitigation strategies and adaptation efforts are essential for protecting society as a whole.
Thoughtful urban planning and the implementation of so-called Heat Action Plans (HAPs) can play an important role in protecting cities from extreme heat. These plans combine short-term responses, seasonal preparedness, and long-term strategies aimed at safeguarding the population, infrastructure, and public health. The first city to introduce HAPs was Ahmedabad in India. While such plans are already in place in many cities across North America, Europe, Australia, and India, they are still lacking in large parts of Africa, the Middle East, South America, and small island states, even though these regions are among those most in need due to rapid urban growth.

The urban adaptation gap. The urban adaptation gap is revealed when levels of achieved adaptation fall short of delivering ‘no risk’; IPCC, 2023
Warning systems also play a key role by providing timely information to the public about approaching heatwaves and enabling the implementation of preventive measures. However, according to UN data, only 54% of national meteorological and hydrological services issue warnings for extreme heat, significant heat stress, or heatwaves.
As part of efforts to raise public awareness about the risks of extreme heat and to encourage institutions to adopt adaptation measures, proposals have recently emerged to name heatwaves similarly to hurricanes. Some cities and organizations are already considering or piloting this approach. The first officially named heatwave in the world was Heat Wave Zoe, which struck Seville, Spain, in July 2022.
How to track extreme temperatures and heatwaves using Windy.com
Windy.com offers a wide range of tools for tracking extreme heat, including official warnings issued by national meteorological services, custom temperature alerts, and specialized forecast layers. In addition to the standard Temperature layer, users can make use of the Wet-bulb temperature and Extreme forecast layers (under the Temperature section), which help identify high-risk situations in advance.

Forecast layer wet-bulb temperature on Windy.com > Windy.com
Wet bulb temperature (WBT) represents the lowest temperature to which air can be cooled through the evaporation of water. It depends on temperature, humidity, and wind. In high humidity, the body loses its ability to cool itself through sweating, which raises the WBT. If the WBT exceeds 35 °C (95 °F), the human body can no longer cool itself, which can lead to thermoregulatory failure and death. This threshold is considered the upper limit of human survivability.
The Extreme forecast (Temperature) layer compares ensemble temperature forecasts from the ECMWF model for a given location with the model’s long-term climatology. It shows how much the expected temperatures deviate from normal values.

City Heat Maps by meteoblue are also available on Windy.com; meteoblue
A unique product is also the City Heat Maps, developed by meteoblue. It displays the distribution of temperatures in urban environments and allows users to observe how heat accumulates and spreads across different parts of a city.
By Jari Sochorová – Windy